In retail operations, most sales occur during the weekend. Orders for replenishment goods arrive at the DC early in the week and must be delivered to the retailer in time for the next weekend activity. The DC has Monday and Tuesday to process and ship the orders. Scheduling of order processing within these two days is dictated by the distances that the goods must travel to reach the retailers: orders processed first are those shipped to the farthest locations, while the orders processed last are those shipped to local customers.
As the market shifts to more frequent deliveries of smaller orders with shorter lead times, two implications critical to DC operations emerge: (1) pre-booked orders decline as at-once orders rise, and (2) orders processed as full-case quantities decrease, or even disappear, as orders requiring piece picking from broken cartons become the norm:
- Pre-booked orders with required lead times of several days or even weeks allowed DC’s to control the order processing schedule, making the operation of the DC more efficient. At-once orders must be processed and shipped as they are received, preventing any advanced scheduling that could optimize the DC’s operation.
- The differences between full-case processing and piece-picking operations are well known; while full-case quantity processing allows the handling of many units with little effort, piece picking is very labor intensive, requiring many resources for handling small quantities.
For DC’s with manual operations, a shift to piece-picking-intensive transactions represents higher labor requirements. As labor costs reach unacceptable levels or as workers begin to literally run into each other because the infrastructure cannot support the additional personnel required to satisfy the customer orders, DC managers are forced to consider other modes of operation.
By adding automatic sortation for order consolidation to a manual system, a DC can process orders in waves, or batches, fulfilling several orders at the same time. In doing so, the units to pick per SKU per transaction increase, allowing the DC to restore some of the full-case quantity processing lost with the new market requirements. However, when the orders being fulfilled are composed of small quantities per SKU per order, retrieving product to feed a sorter still can be very demanding. DC’s may purchase a sorter only to discover that they lack sufficient retrieval capacity to feed it.
In my article “Designing Distribution Centers: Shifting to an Automated System,” I presented equations to calculate throughput requirements for automated systems with sorters. One of the conclusions from that article, namely that the segregation of the storage according to carton condition (full-case or residual) optimizes the feeding of the sorter, is the concept underlying the QARS model for DC design.
When we analyze operational data of a DC collected over an extended period of time—say, six months or a year—we typically find that a small portion of the DC’s available SKUs, known as fast movers, account for the majority of the DC’s activity. Similarly, when we analyze the same operational data at a wave level, we see that in each wave a small portion of the total SKUs required to fill the wave’s orders accounted for a large portion of the wave’s total units. Further analysis also indicates that:
- The fast-moving SKUs for a particular wave do not necessarily match the fast-moving SKUs in the DC’s total inventory.
- The slow-moving SKUs for a particular wave do not necessarily match the slow-moving SKUs in the DC’s total inventory.
- The fastest moving SKUs in a wave change from wave to wave.
Traditional designs segregate inventory based on the activity level of SKUs, fast-movers or slow-movers. Using this concept, fast-moving SKUs are placed in storage devices where they are easily accessible, facilitating the majority of the transactions. However, this approach presents some complications. To illustrate, let us assume a DC operation where 20% of the SKUs account for 80% of the activity:
- If the fast-moving SKUs represent 80% of the DC’s activity, they will also represent 80% of the inventory on hand. If we place all the fast-moving SKU inventory in the fast-moving storage device, we would require storage capacity for 80% of our stock. We may as well have all the inventory in the fast-moving storage device.
- If we split the fast-moving inventory between a small active area equipped with the fast-moving device and a large reserve area, we solve the problem of a large storage capacity requirement for the fast-moving storage device. However, we must now double handle all fast-movers (80% of our activity) because of the replenishment requirements of the active zone from the reserve zone.
- A DC’s fast-moving SKUs are not always the same SKUs. The activity level classification for each SKU must be frequently re-evaluated to see if the SKU still belongs in its current storage area (fast-moving or slow-moving). If SKU classification changes, all inventory with that SKU must be moved to the other storage area.
The QARS model, described in the following section, resolves the complications associated with activity-based segregation of inventory.
The QARS Model
The QARS model exploits an operational strategy that segregates inventory based on the carton quantity, full-case cartons or residual cartons (previously open cartons with less units than the original full-case quantity), regardless of whether the carton contains fast- or slow-moving SKUs. It does not require any planning or additional handling for the inventory in residual storage.
In piece-picking operations, transactions related to residual cartons account for a large portion of the DC activity and an even higher portion of the required resources. In a QARS-based DC design, the handling of the residual cartons is automated, which greatly simplifies a piece-picking operation.
Let us consider a QARS-based DC with:
- A sortation system to which both full and residual cartons are conveyed, and where operators at sorter induction stations pick the units required for the wave in progress
- A bulk storage area made of conventional rack with sufficient storage capacity for all full-case cartons in the facility
- A residual storage area consisting of a high-throughput AS/RS for residual carton retrieval and putaway, with sufficient storage capacity for at least one residual carton per SKU
The system is operated as follows:
- If the requested quantity for a SKU is less than the quantity available from the carton in the residual storage, the units are inducted from the residual carton and the carton is returned to the residual storage.
- If the requested quantity for a SKU is equal to the quantity available from the carton in the residual storage, all units are inducted from that carton. The empty carton is removed from circulation.
- If the requested quantity for a SKU is larger than the quantity available from the carton in the residual storage, all units from the residual carton are inducted and the empty carton is removed from circulation. Additional cartons are conveyed from the bulk storage area and units from full-cases are inducted until the requested quantity is reached. Empty cartons are removed from circulation. If there are residual units in the last carton, this carton is sent to residual storage.
Example 1
Full-case carton quantity = 25
Units in residual storage carton = 10
Requested quantity = 7
Transactions
- The residual carton with 10 units is transferred to the sorter induction workstations, and 7 units from this carton are transferred to the sorter.
- The residual carton, which now contains 3 units, is returned to residual storage.
Example 2
Full-case carton quantity = 25
Units in residual storage carton = 3
Requested quantity = 38
Transactions
- The current residual carton with 3 units is transferred to the sorter induction workstations and completely depleted, that is, 3 units from this carton are transferred to the sorter.
- Two full-case cartons from bulk storage are transferred to the sorter induction workstations. All 25 units from the first carton are transferred to the sorter plus 10 units from the second carton.
- The second carton, now the new residual carton with 15 units, is sent to residual storage.
The QARS model is flexible enough to support specific DC requirements—for instance, if a DC is required to never fully deplete SKUs in the residual storage area, the design can be altered to allow for the temporary presence of more than one carton per SKU in the residual storage.
A QARS Case Study
To help illustrate the application of QARS in a real-world situation, consider the following case study:
A DC receives and stocks full-case quantities of product (pure-SKU receiving cartons) and consolidates smaller quantities of multiple SKUs for customer delivery (mixed-SKU shipping cartons). The DC does not have control over its retailers’ orders, so it cannot arbitrarily ship the residual units from open cartons to empty them. All shipped units must be the SKUs and quantities specified by the retailers. For design purposes, all orders are assumed to be at-once orders. The operation consists of:
- 8,000,000 shipped units per year
- 20 units per receiving carton (average)
- 1,000,000 units required storage capacity
- 10,000 available SKUs in storage
- 80,000 units shipped per day (design and peak day)
- 7 operating hours per day
When designing DCs based on historical data, it is common practice to select a very busy actual day of the DC’s recent past operation and to use the activity of that day as the design basis. I find it rather risky to base an investment of several million dollars on such limited data. Even if the shipped volume on the selected day is equal to the design value, there is no guarantee that the shipping profiles (number of active SKUs, for instance) of the selected day should be used for the design. A safer practice is to analyze the shipping profiles over a longer period of time and, using statistical tools and simulation modeling, create multiple “design days” based on those profiles, expected changes, and the design shipping volume. Later, if desired, the design model can be validated with the data from any historical day.
To define the design order profile, historical shipping data from the DC’s nine consecutive busiest weeks was used. Important statistics from this period include:
- 1,900,000 units shipped
- 30.1 units per order (average)
- 10.1 SKUs per order (average)
- 2.98 units per SKU per order (average)
- 2,000 SKUs (fast movers) account for 80% of the DC’s total SKU activity
In my previous article, I explained the importance, as a design parameter, of the units to process per wave (and the corresponding expected SKUs per wave): A large number of units per wave implies a larger sorter that requires less AS/RS throughput capacity to feed it, while a small number of units per wave implies a smaller sorter that requires more AS/RS throughput capacity.
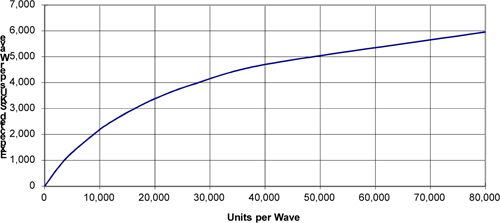
Through simulation, and using the historical shipping profiles, the expected number of active SKUs per wave, as a function of the wave size (in units), was calculated for this particular case study. The following chart presents the results of these calculations:
An explanation of how to determine the optimal operating conditions for such a system can be found in my previous article. Let us assume that the optimum operating conditions for this DC require seven one-hour waves per day (an average of 11,426 units per wave).
If the DC operates under design, or peak, conditions an average of 20 days per year, a simulation of 600 days under peak conditions would be equivalent to checking the DC’s worst conditions for 30 years. Under these operating conditions, the simulation model yields the following throughput requirements:
| Minimum | Average | Maximum | |
|---|---|---|---|
| Total Active SKUs per Wave | 2,217 | 2,404 | 2,594 |
| Piece Pick as % of Total Pick | 81% | 87% | 92% |
| Bulk Storage (Conventional Rack) | |||
| Active SKUs per Wave | 469 | 535 | 601 |
| Retrieved Full-Cases per Wave | 512 | 572 | 639 |
| Residual Storage (AS/RS) | |||
| Active SKUs per Wave | 2,191 | 2,383 | 2,574 |
| Retrieved Residual Cartons per Wave | 2,081 | 2,264 | 2,445 |
| Putaway Residual Cartons per Wave | 2,081 | 2,264 | 2,445 |
The corresponding storage, based on design requirements, is:
| Full-Case | Residual | Total | |
|---|---|---|---|
| Inventory on Hand (Cartons) | 45,000 | 10,000 | 55,000 |
| Average Units per Carton (*) | 20 | 10 | |
| Inventory on Hand (Units) | 900,000 | 100,000 | 1,000,000 |
| Storage Utilization (**) | 75% | 95% | |
| Required Carton Locations | 60,000 | 10,526 | 70,526 |
| % of Storage Locations | 85% | 15% | 100% |
| Throughput (Cartons per Hour) | 572 | 4,528 | 5,100 |
| % of Throughput | 11% | 89% | 100% |
(*) Full-case cartons have all their original units, residual cartons have half their original units.
(**) Storage utilization is storage locations with cartons divided by total storage locations.
Today’s emerging technologies, which focus on throughput rather than storage, provide devices capable of up to 750 dual transactions per hour (one dual transaction is equivalent to one retrieved carton and one putaway carton) at reasonable prices.
For residual cartons in this case study, we can use AS/RS carousels, each with a throughput capacity of 600 dual transactions per hour and 2,630 carton locations for storage. Four of these AS/RS carousels provide all the throughput and storage capacity required for residual cartons.
The simulation indicated some instances where the required throughput from the AS/RS carousels exceeded 2,400 dual transactions per hour. Further, some imbalance between the requirements for each AS/RS carousel during the waves is to be expected, as well as some inefficient utilization of the AS/RS carousels during transition between waves. These conditions extend the duration of some waves beyond the allowed 60 minutes. Some options to deal with these situations are: (1) allowing some overtime at the end of the day, (2) a buffer (like conveyor queues) between the AS/RS carousels and the sorter, and (3) more throughput capacity (five AS/RS carousels instead of four).
The number of SKUs that require manual handling during a wave, which can be related to the number of locations to visit in a manual system, is reduced from 2,059 to 517. More importantly, the eliminated SKUs are those associated with dual transactions (one retrieval and one putaway); the remaining SKUs are associated with only full-case retrievals.
Despite having an 87% piece-picking operation, all manual product retrieval is full-case (piece counting still is performed manually at sorter induction). Through the automation of only 15% of the DC’s total storage, 89% of the required handling is automated, without any double handling of product.
The DC can accept waves, or batches of orders to ship (up to the capacity of the sorter), every hour. Two and a half hours after receiving a batch, regardless of SKU mix, all the orders can be in trailers, packed and loaded, ready to leave. The QARS-based system has no dependencies on any kind of wave balancing.
Summary
A QARS-based system design allows a DC to respond immediately to any set of orders with very short notice. Processing of orders can be scheduled based on customer needs rather than the DC’s available resources.
Transactions between the residual storage area and the sorter must be dual transactions at the time of order processing, as this is the kind of transaction supported by AS/RSs. In contrast, transactions from bulk storage racks may be single transactions, as the complementary transaction—that is, putaway from receiving—can occur at non-peak periods. This condition allows the DC to manage and schedule labor resources in the most efficient manner.
Product in the AS/RS carousels need not be continually re-evaluated; residual cartons belong there and full-case cartons do not. All cartons are touched only three times: (1) at receiving, (2) when they are put away in the bulk storage rack, and (3) when they are taken to the sorter. Replenishment of the AS/RS carousels is automatic, simple, and does not require any planning or additional handling of the product.
Each DC is unique, with its own specific needs and requirements. It would be naïve to presume that there is a universal solution for all the possible situations. Nevertheless, the QARS model provides a good design base for those operations in which increasing piece-picking requirements and decreasing required processing times are forcing the DC managers to contemplate alternative modes of operation.